Back to: Introduction to R
It can be hard to view trends with just points alone. Many times we wish to add a smoothing line in order to see what the trends look like. This can be especially helpful when trying to understand regressions.
We will take out scatter plot and apply a smoothing line to this:
ggplot(data, aes(x=distance, y= dep_delay)) +
geom_point() +
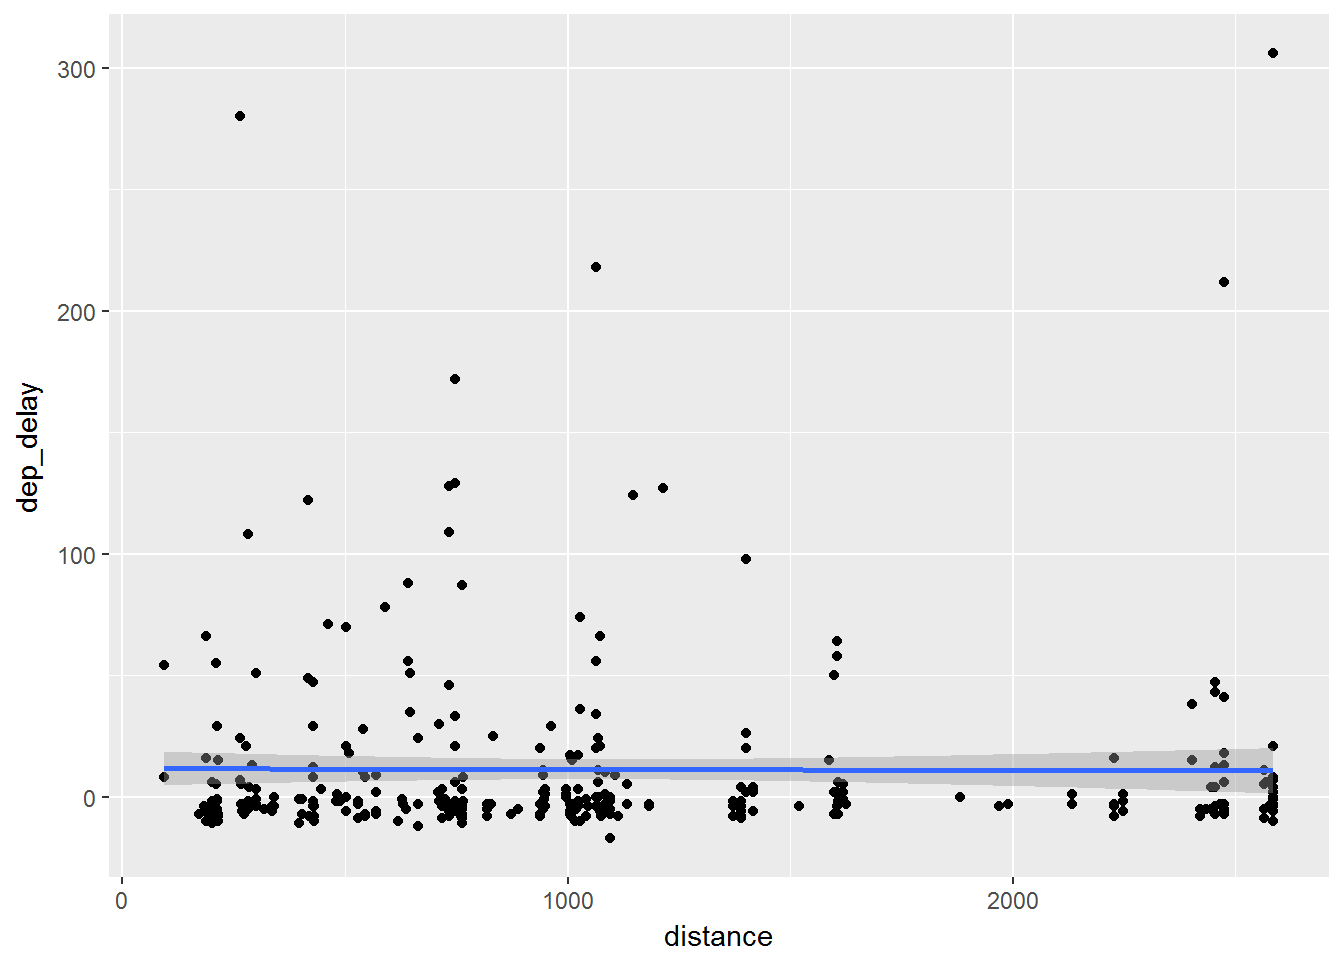
geom_smooth()Again, the smoothing line comes after our points which means it is another layer added onto our graph:

Note that the geom_smooth() function adds confidence bands on the smooth as well. We can remove these by adding se=FALSE inside the geom_smooth() function:
ggplot(data, aes(x=distance, y= dep_delay)) +
        geom_point() +
        geom_smooth(se=FALSE)
This produces the following plot:

On Your Own
Consider what happens when you switch the layers around.
1. Graph just the data step:
ggplot(data, aes(x=distance, y= dep_delay))2. Then add just the smooth
ggplot(data, aes(x=distance, y= dep_delay)) +
    geom_smooth()
3. Finally add the points in:
ggplot(data, aes(x=distance, y= dep_delay)) +
    geom_smooth() +
    geom_point()
Note what happens as you slowly build these layers. This is a major part of the power of ggplot2
Varying the Smooth
We have so far just seen how to add the smooth without being able to do anything but add or subtract the confidence bands. We now will change the smoothness of our smooth that we added. To do so we add span=__ inside the geom_smooth() layer:
ggplot(data, aes(x=distance, y= dep_delay)) +
        geom_point() +
        geom_smooth(span = 0.1)
ggplot(data, aes(x=distance, y= dep_delay)) +
        geom_point() +
        geom_smooth(span = 1)
Above shows the coding for 2 possibilities of these changes to the smooth.
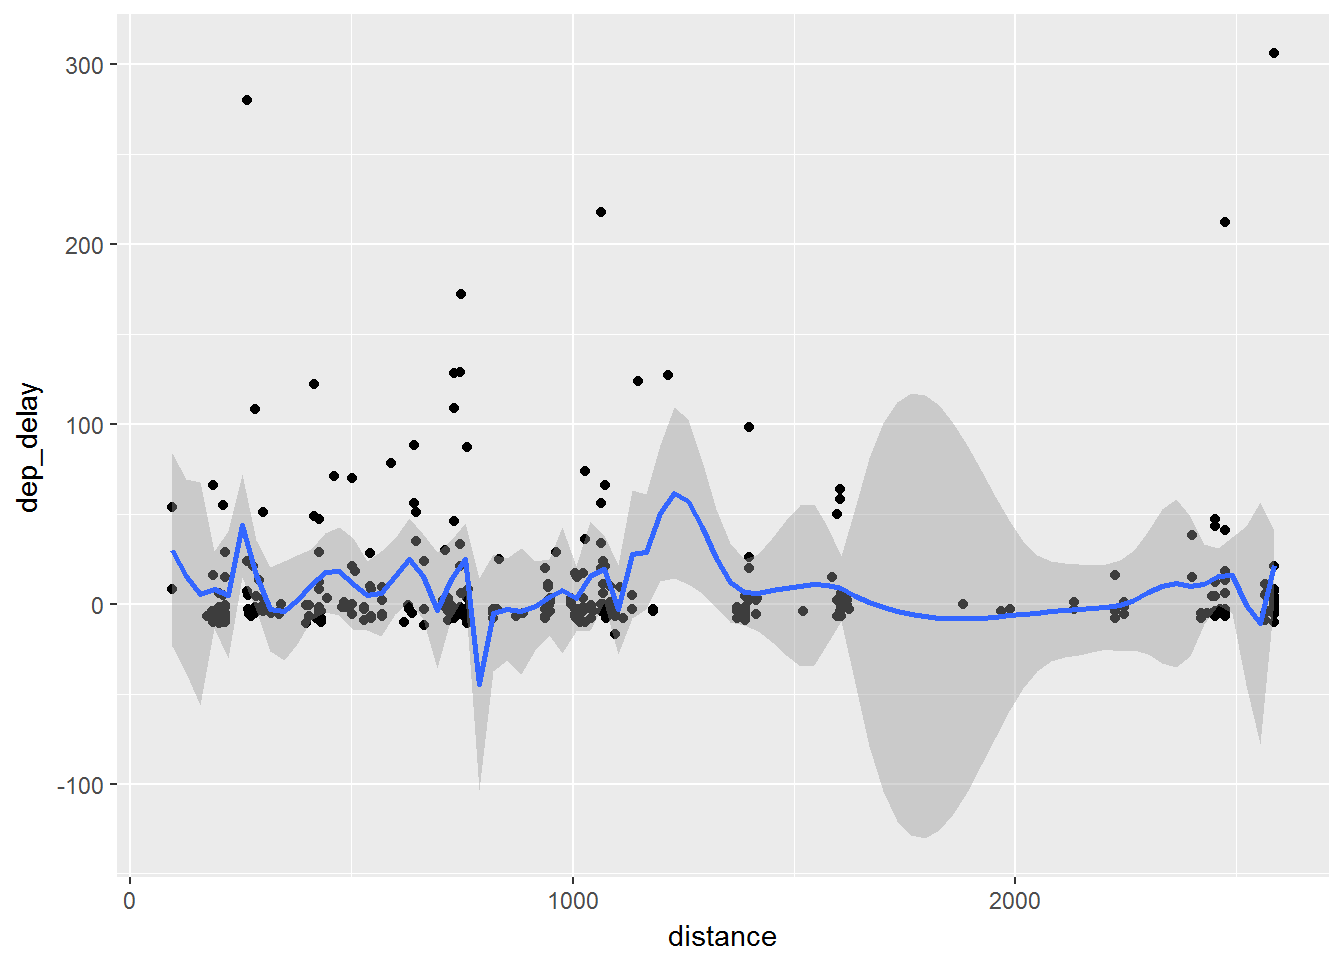
Note that with span = 0.1 we have a more rough smoothing than we had previously.

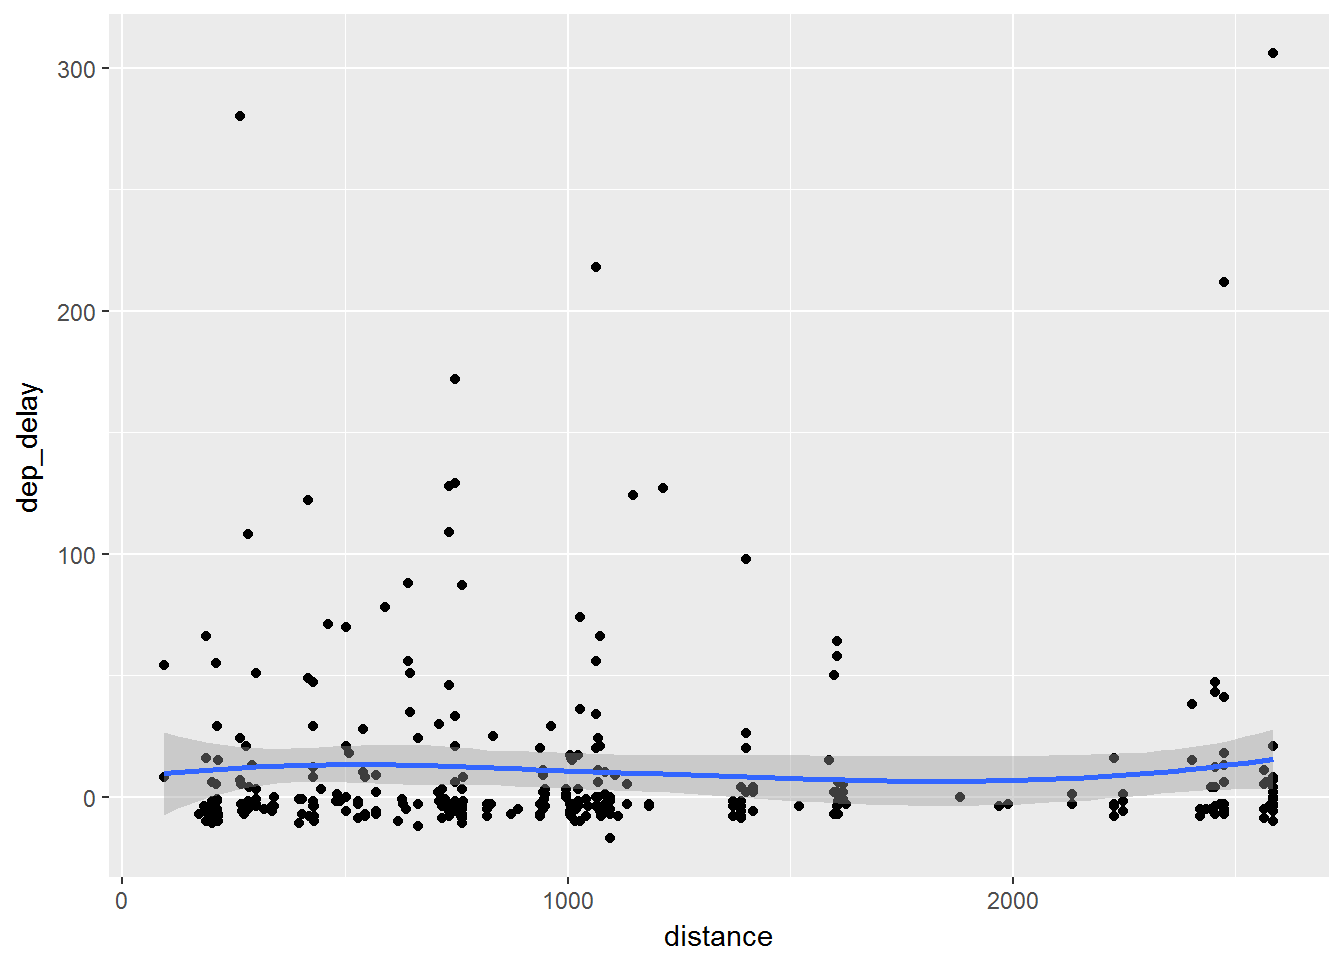
When we changed the span = 1 we can see that this is much smoother. The span can be varied from 0 to 1, where 0 is very rough and 1 is very smooth.
Different Types of Smooths
There are different types of smooths that we can do. We will consider:
loess
gam
Loess Smooths
Loess smoothing is a process by which many statistical softwares do smoothing. In ggplot2 this should be done when you have less than 1000 points, otherwise it can be time consuming.
ggplot(data, aes(x=distance, y= dep_delay)) +
        geom_point() +
        geom_smooth(method="loess")
As you can see with the code we just add method="loess" into the geom_smooth() layer.
gam Smoothing
gam smoothing is called generalized additive mode smoothing. It works with a large number of points. We specify this by adding method="gam", formula = y~s(x) into the geom_smooth() layer.
library(mgcv)
ggplot(data, aes(x=distance, y= dep_delay)) +
        geom_point() +
        geom_smooth(method="gam", formula = y ~s(x))
The code for this is very similar and we can see how it looks below: