Back to: Introduction to R
We will display the code for a couple for common graphs below:
Bar Charts
ggplot(data, aes( carrier) )+
         geom_bar()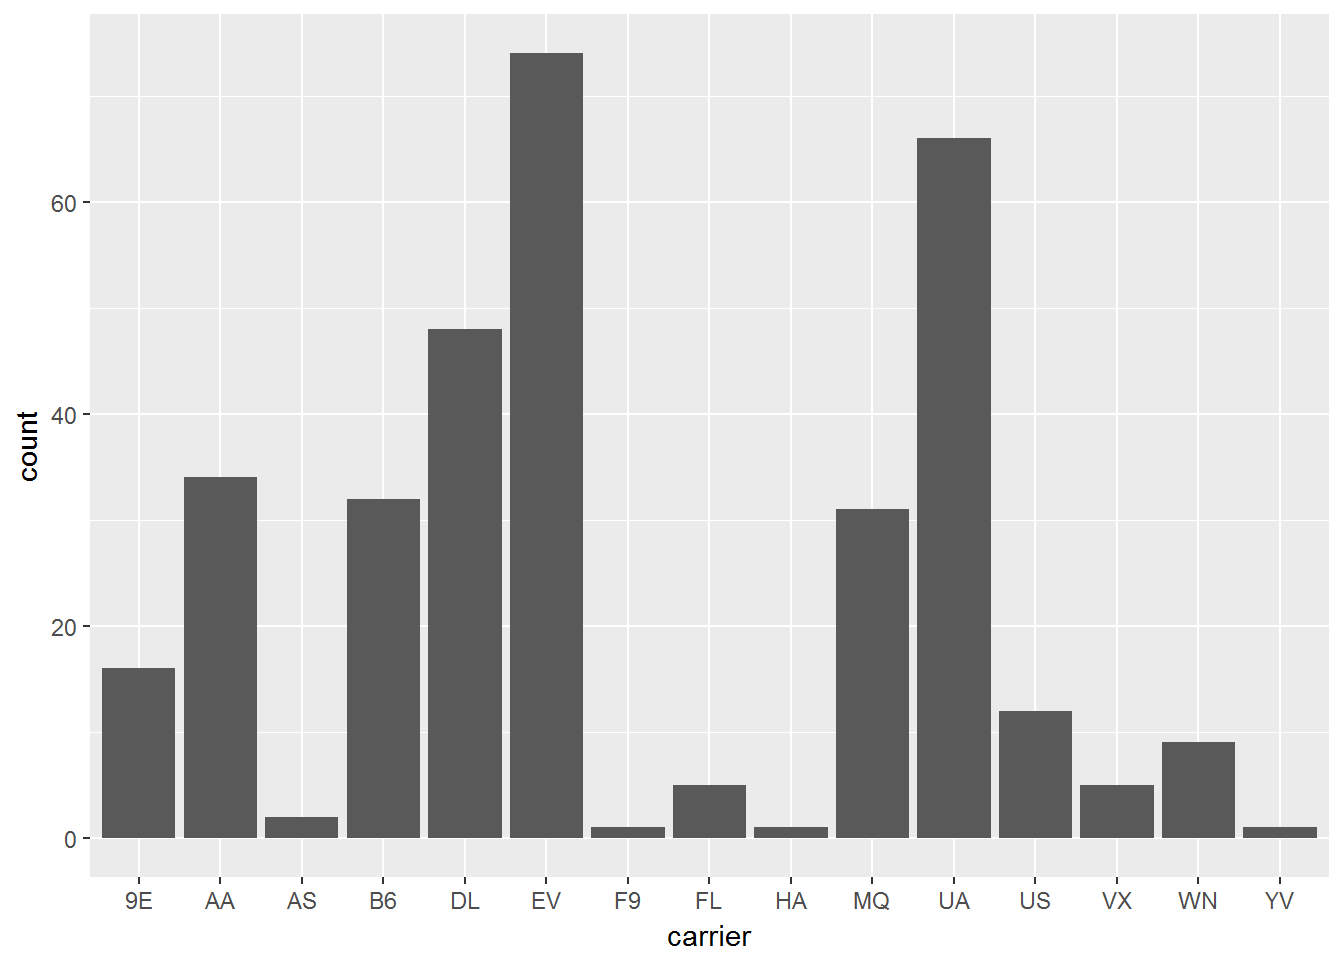
Line and Path plots
ggplot(data, aes(dep_delay, distance/air_time*60 )) +
  geom_line()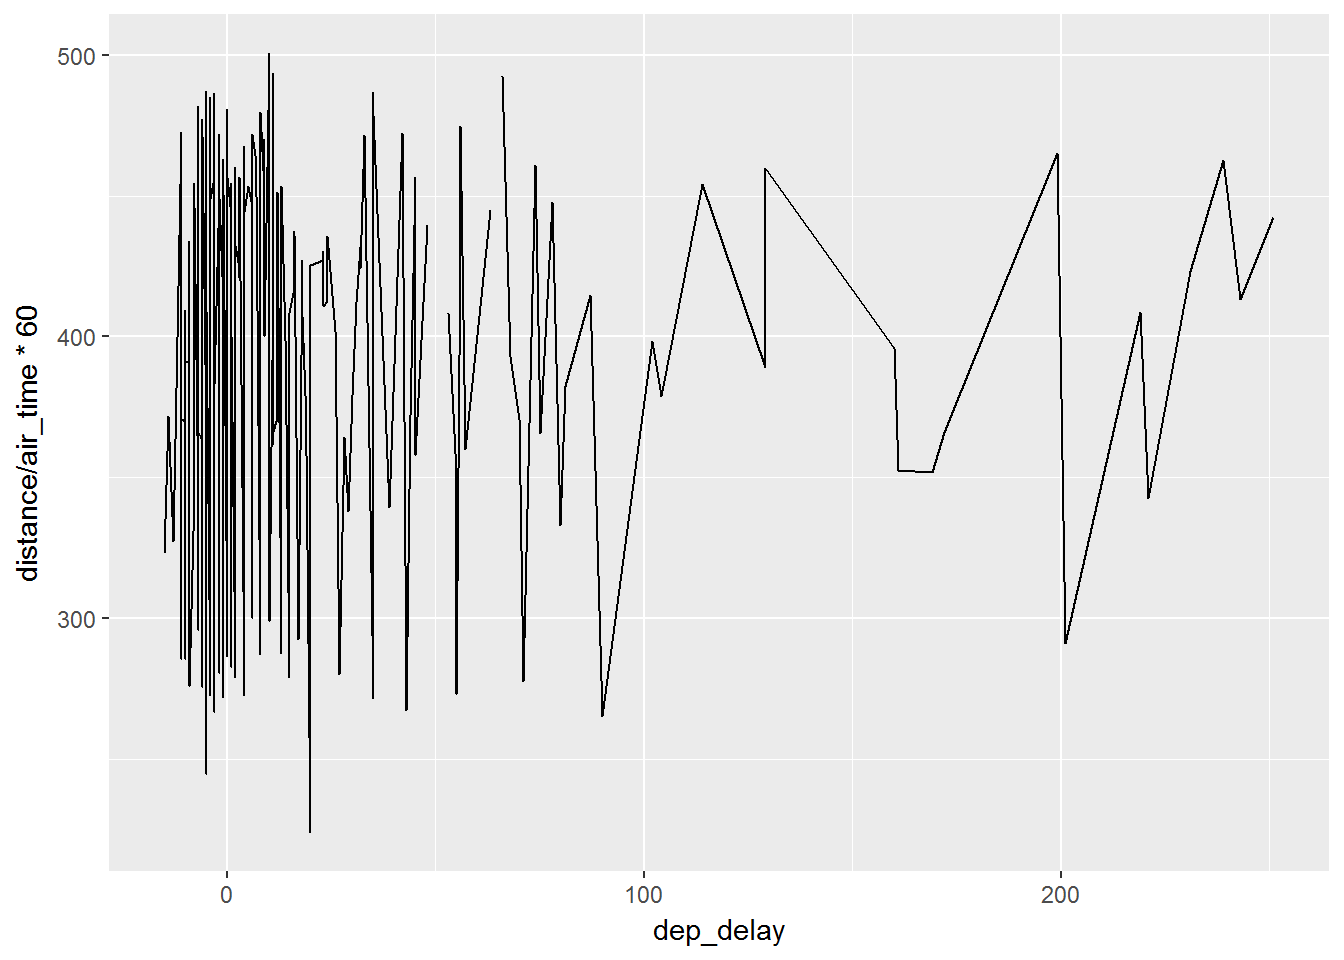
Back to: Introduction to R
We will display the code for a couple for common graphs below:
ggplot(data, aes( carrier) )+
geom_bar()
ggplot(data, aes(dep_delay, distance/air_time*60 )) +
geom_line()