Back to: Introduction to R
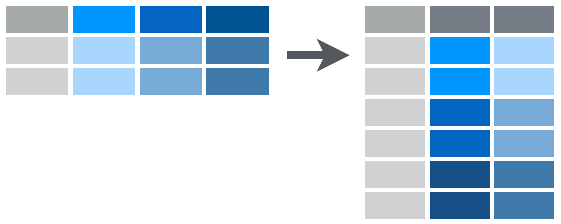
The second tidyr function we will look into is the gather() function. With gather() it may not be clear what exactly is going on, but in this case we actually have a lot of column names the represent what we would like to have as data values.

For example, in the last spread() practice you created a data frame where variable names were individual years. This may not be what you want to have so you can use the gather function. The picture above displays what this looks like. Consider table4:
## # A tibble: 3 × 3
##       country `1999` `2000`
##        <fctr>  <int>  <int>
## 1 Afghanistan    745   2666
## 2      Brazil  37737  80488
## 3       China 212258 213766
This looks similar to the table you created in the spread() practice. We now wish to change this data frame so that year is a variable and 1999 and 2000 become values instead of variables. We will accomplish this with the gather function:
gather(data, key, value, ...)where
data is the dataframe you are working with.
key is the name of the key column to create.
value is the name of the value column to create.
... is a way to specify what columns to gather from.
gather() Example
In our example here we would do the following: `
table4 %>%
    gather("year", "cases", 2:3)
## # A tibble: 6 × 3
## country year cases
## <fctr> <chr> <int>
## 1 Afghanistan 1999 745
## 2 Brazil 1999 37737
## 3 China 1999 212258
## 4 Afghanistan 2000 2666
## 5 Brazil 2000 80488
## 6 China 2000 213766You can see that we have created 2 new columns called year and cases. We filled these with the previous 2nd and 3rd columns. Note that we could have done this in many different ways too. For example if we knew the years but not which columns we could do this:
table4 %>%
    gather("year", "cases", "1999":"2000")
We could also see that we want to gather all columns except the first so we could have used:
table4 %>%
    gather("year", "cases", -1)
All of these will yield the same results.
On Your Own: RStudio Practice
Create population2 from last example:
population 2 <- population %>%
                    spread(year, population)
Now gather the columns that are labeled by year and create columns year and population. In the end your data frame should look like:
## # A tibble: 2 × 3
##       country  year population
##         <chr> <int>      <int>
## 1 Afghanistan  1995   17586073
## 2 Afghanistan  1996   18415307