Back to: Report Your Findings
The study flowchart is basically a visual representation of your searching and screening process. This is where you show how you took a large pile of evidence and whittled it down to the most relevant literature.
If you remember from earlier in the course, PRISMA stands for Preferred Reporting Items for Systematic Reviews and Meta-Analyses. The study flow chart was put forward by the PRISMA committee that revised the set of standards for reporting systematic reviews. It’s now one of the required elements for any published systematic review.
The study flowchart starts with the number of articles you found in your initial search (and any gray literature you found using other techniques) and then describes how many were removed through the screening and analysis process.
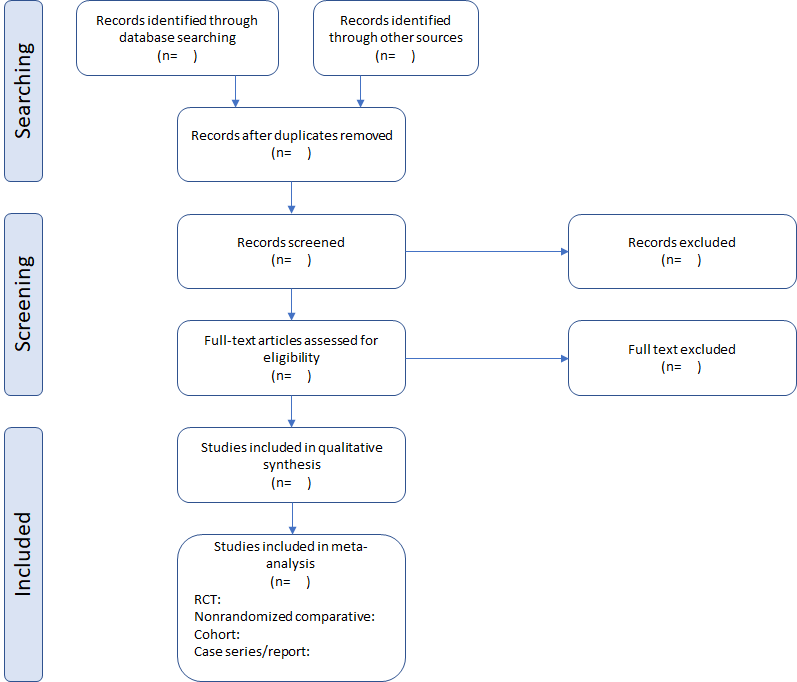
Below is a blank study flowchart that you can use as a model for your systematic review.