Back to: Analyze & Synthesize Data
The random effects model assumes that the ultimate truth about the effect of a treatment is made up of a range of possible truths, all slightly different because of each study’s particular characteristics and participants.
You’d draw that scenario this way:
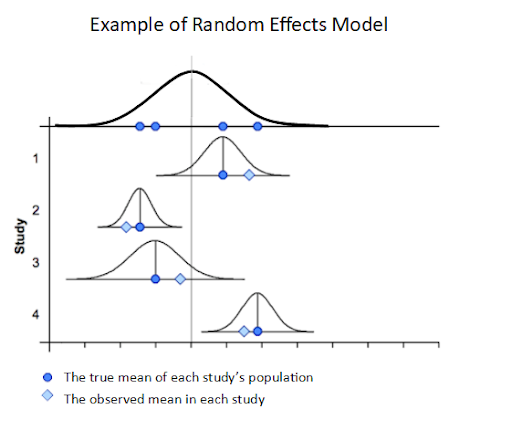
The blue circles are still the true effects in each study, but in this model, they differ from study to study, because they all represent a different truth that’s specific to where the study took place and who was included in the study. This is unlike the common effect model where the true study effects were all the same.
The curves still represent the range of possible study results, and the diamonds represent the actual results from each study.
You might notice that the blue diamonds (the study results) are more spread out in this image. That’s because they’re all centered around slightly different “true effects.”
Unlike in the common effect model, where the “true effect” was one number, in the random effects model, we have a range of true effects. When they’re lined up together, they center around an overall average. That overall average is the result of your meta-analysis, expressed as the gray line that runs down the center of the graph.