Back to: N-of-1 Trials: A scientist in your back pocket
Research subjects can even look at their own data to track their progress. For example, in an N-of-1 trial about improving chronic pain, the research subject might see a chart like this
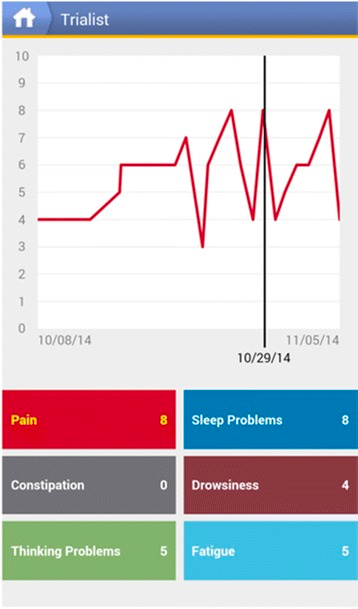
This screen shows a person’s pain scores over the course of a month. Higher scores indicate more pain. On some days the patient had a lot of pain, on other days they had less. These levels might be potentially related to the intervention the person was trying at the time.