Back to: Analyze & Synthesize Data
You might hear this process referred to as a “leave one out” analysis. You display it like you’d display a forest plot. Except in this case, the square and the line represent your final result and its confidence interval after you’ve removed one of the studies.
Below is an example of what that looks like:
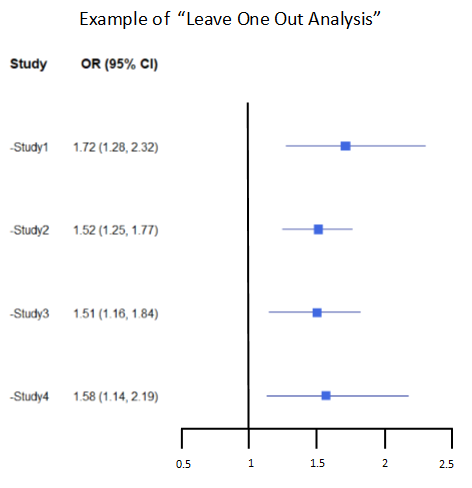
The first row is the meta-analysis without Study 1 (so only studies 2, 3, and 4 are included), the second row excludes Study 2 (so only uses studies 1, 3, and 4), and so forth…
You’ll use this image to compare your results. Are they similar or different from your original answer? If they’re remarkably different, that tells you that a particular study had a large influence on your results. It might be worth examining why.