Back to: Analyze & Synthesize Data

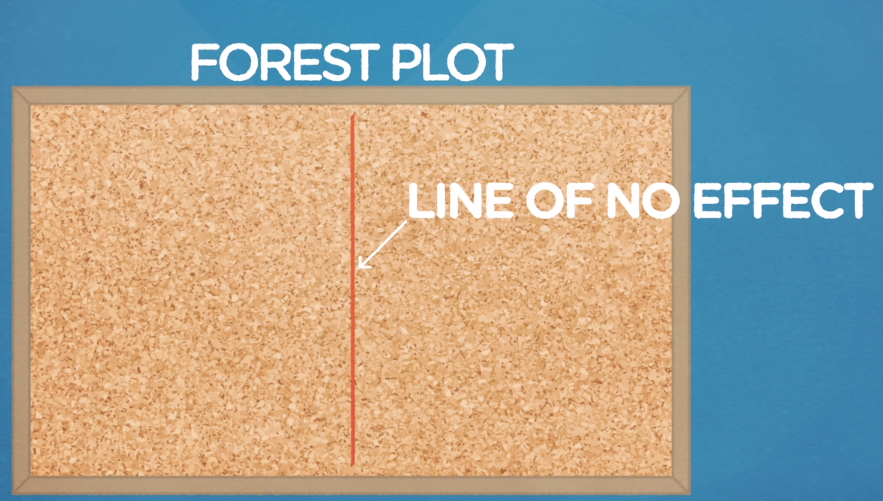
Want to make a forest plot? Start by creating a vertical line. This line is known as the “line of no effect.” It splits your plot into two sections:
– One side is for studies that say the newer headache drug is more effective.
– On the other side, you’ll put studies that say the standard medicine is more effective.
Next, you’ll draw each study’s result and place them around this line.