Back to: Analyze & Synthesize Data
How is it possible that we averaged the same set of numbers and got two different answers? In the end, do we conclude that the students with experience score higher or that they score the same as students without experience?
This is an example of what’s called “Simpson’s paradox.” It shows that the order in which you combine information can make a big difference in your final result. It can even completely change your conclusions.
The visual below illustrates the two ways you might combine and average your results.
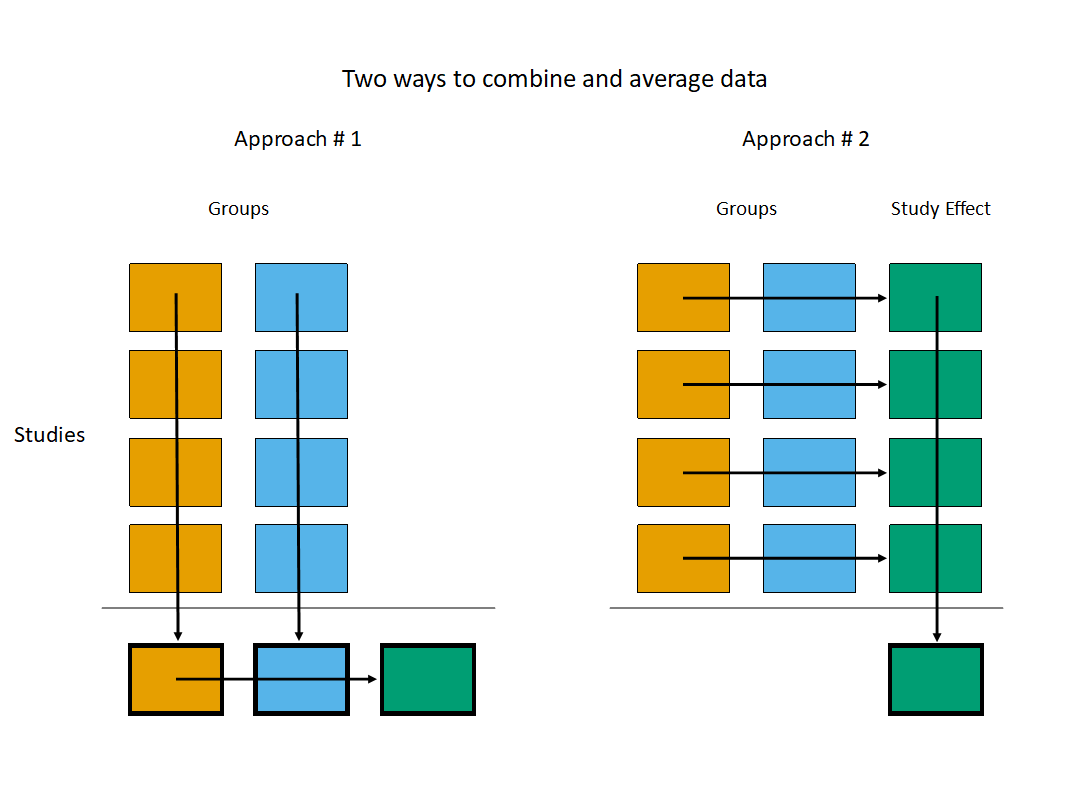
In this example, think of the orange squares as the test scores for students with work experience and the blue squares as the test scores for students without work experience.
Approach #1 shows how we compared the scores in the first example – we averaged all of “experienced” student scores, did the same for the other students, and then subtracted these averages to find the difference between the scores.
Approach #2 shows how we compared the math scores in the second example – first we found the score differences within each class, and then we combined all of those differences.